Good vision is often a requirement for many professions. In part one of this two-part series on vision, Professor David Thomson looks at vision screening standards and their place in occupational health.
Before reading this article, try closing your eyes for a few seconds. Imagine how difficult life would be without the sense of vision. Tasks that we take for granted, such as dressing, eating, travelling to work and reading suddenly become extraordinarily difficult.
| Part two | |
| In the second part of this article, the principles of vision screening will be outlined and vision screening instruments discussed. It will conclude with a review of problems associated with using display screen equipment and how to use vision screening to identify those who need an eye examination. | |
In part one of this two-part series, we outline the process behind establishing evidence-based vision standards and describe four of the most important aspects of vision.
Technical challenges
The human visual system is a masterpiece of design and engineering. Despite the huge amount of time and money invested to try to get computers to “see”, no machine comes close to matching it.
The problem is not how to capture an image – the phone in your pocket can do that. The challenge is translating that two-dimensional image into a full understanding of the three-dimensional world it represents. After all, that is what the human visual system does.
All we have to do is open our eyes and we have a complete understanding of our surroundings. We recognise people and objects and can work out their relative positions in the three-dimensional world. We can navigate through complex environments.
Our vision works in bright sunlight and yet we can still see by moonlight, when there is 10,000 million times less light. We can judge distances down to a fraction of a millimetre and differentiate between millions of unique colours and shades.
The apparent ease with which our visual system functions belies the complexity of the task. While the first few stages of the process – those that relate to the eyes – are now reasonably well understood, we are a long way from a full understanding of how the brain converts activity in the two million nerve fibres coming from the eyes into the rich perception of the world that we enjoy.
For a hugely complex “machine”, the visual system is remarkably robust and most people enjoy good vision – with the occasional help from visual aids such as glasses – throughout their lives. However, the system can and does develop a wide range of problems that result in a spectrum of visual deficits. Some of these can be overcome with visual aids, while others require medical treatment or surgery.
There are also still a number of conditions for which there is no effective cure or management, and visual impairment or blindness is the consequence.
Good vision is a prerequisite for many occupations. However, the visual demands vary hugely between occupations as do the consequences of visual deficits.
|
|
An HGV driver must be able to see clearly in the distance, judge distances accurately and perceive objects in the peripheral field – the consequences of not being able to do so are potentially catastrophic.
A computer user requires good visual acuity at an intermediate distance, but depth perception may be less important. While the consequences of poor vision to a computer user may not be as catastrophic as for an HGV driver, suboptimal vision can lead to discomfort, inefficiency and errors. To a printer, good colour vision may be a prerequisite of the job, while good night vision might be a key attribute for a pilot.
The importance of specific vision attributes to allow the safe and efficient performance of particular tasks led to the development of occupational vision standards. These are a set of requirements that help ensure that those starting a particular job have adequate vision to perform the tasks safely (pre-employment) and that this standard is maintained post-employment.
Vision standards
Occupational vision standards have a rather chequered history. Many standards were little more than numbers plucked out of the air by a panel of “experts”.
However, given the potential risks of setting ad hoc standards, a rather more scientific approach has been adopted in recent years in a bid to make standards a little more evidence based.
The process is still fraught with difficulties, however, because an individual’s ability to perform a task is based on the interaction of a huge number of factors, including experience, natural aptitude, motor coordination and personality. While good vision forms part of the equation, its contribution is not always straightforward and a degree of common sense should always be used when assessing vision.
The modern approach to setting vision standards involves a number of stages. The first stage is a “visual task analysis” where the precise visual demands are assessed systematically. For example, a visual task analysis for a pilot might include an assessment of the size and nature of the information presented in a cockpit, the range of viewing distances, the colours used on displays and for landing lights and so on. The relative importance of each of these aspects of vision is assessed and considered alongside the potential consequences of specific visual deficits.
The second stage of the process involves deciding on the aspects of vision that are critical for the task and setting appropriate standards. For example, if good distance vision is essential, a demanding distance visual acuity standard would be imposed. If good colour vision is a prerequisite, a standard that excluded those with certain types of colour vision defect might be set.
The final stage in the process is to determine how these aspects of vision are to be assessed, how often and by whom. For occupations where the consequences of poor vision may be catastrophic, it may be that the screening process is carried out by an eyecare professional such as an optometrist or ophthalmologist. In other situations, an assessment using a vision screening instrument conducted by an in-house team may be adequate.
Setting an example
Perhaps the best known example of a vision standard is that set for group 1 drivers (cars), which states that all drivers should be able “to read in good light (with the aid of corrective lenses if necessary) a registration mark fixed to a motor vehicle and containing letters and figures 79.4mm high at a distance of 20.5m. In addition, the visual acuity (with the aid of glasses or contact lenses if worn) must be at least 6/12 (0.5 decimal) with both eyes open, or in the only eye if monocular.”
This is checked by an examiner during the driving test and may be reassessed by a police officer if there is reason to believe that a driver does not meet this standard.
The standard has been criticised for its vague nature and the fact that there is no requirement to confirm that a driver continues to conform with it. As a result, it is possible to drive for many decades without having any form of vision test.
Vision standards have been developed for many occupations. While the requirements for different occupations vary widely, most standards specify a visual acuity criterion for distance and near vision, while some impose requirements for colour vision, depth perception and peripheral vision.
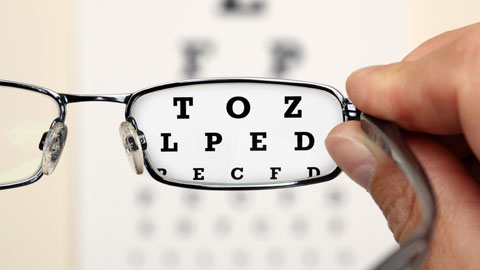
Visual acuity
Visual acuity is perhaps the most frequently tested aspect of vision. Clinically, visual acuity is assessed by measuring the smallest letters an observer can read from a “distance”. The first letter chart for testing vision was developed in 1862 by Herman Snellen, a Dutch ophthalmologist. His chart design has survived relatively unchanged and is still used in many clinics. A Snellen chart is usually placed at a standard distance, which is set at 6m in the UK.
Snellen found that individuals with “normal vision” could generally recognise letters subtending five minutes of arc, where one minute is 1/60th of a degree. He suggested that letters of this size should be designated as 6/6 (20/20 in the US) where the numerator represents the viewing distance and the denominator is the distance at which the letters subtend five minutes of arc. Above and below this row the letters increase and decrease in size respectively, following an approximate geometrical progression. For each row, the denominator gives the size of the letters. For example, the letters on the 6/12 row are twice the size of those on the 6/6 row, while the 6/60 letter is 10 times the size.
Visual acuity is generally measured monocularly – one eye at a time – and by asking the patient to read the smallest letters they can.
While the Snellen chart provides a useful measure of visual acuity, it has a number of design flaws that affect its accuracy. In recent years, an alternative chart design known as the Bailey-Lovie (LogMAR) chart has been adopted by an increasing number of clinics.
|
|
Computer-based test charts have also become very popular. These use a standard computer and flat-panel display to generate a huge range of test charts and visual test stimuli. They also allow the letters to be scaled for different viewing distances and for the letters to be randomised for each test to prevent memorisation of the letters.
Refractive errors, in particular short-sightedness and astigmatism, are the most common causes of reduced-distance visual acuity among the working population. However, other conditions such as amblyopia, macular degeneration and cataracts can also cause a reduction in visual acuity and should be excluded by a full eye examination by an optometrist.
Many jobs require good near vision and so a near visual acuity standard is sometimes imposed. Near visual acuity can be measured using a miniature test chart scaled for a typical reading distance (40cm) or by using a near-test-type card. These have paragraphs of text printed in different font sizes and the patient is required to read the smallest text that they can from a normal reading distance. The corresponding font size in points is recorded. The point size refers to the height of the body of the letter in units of 1/72 of an inch and does not relate to the Snellen acuity chart.
A number of apps for assessing near vision are also available for tablet devices, which offer a range of near-vision tests and greater versatility than printed cards.
Colour vision
Colour vision is the ability to distinguish objects based on the wavelengths of light they reflect, emit or transmit. Colour vision adds another dimension and aesthetic quality to vision, and is also useful for detecting and differentiating between objects.
Many workplace tasks require some degree of colour discrimination – for example, colour bands on electronic components, signal and warning lights, and colour coding on maps and computer displays.
Colour vision is a complex process requiring the comparison of the relative stimulation of three types of cone photoreceptors in the retina, sometimes referred to as blue, green and red cones.
Approximately 8% of men and 0.5% of women have an abnormality with one or more of the cones, which can range from a slight difference in the absorption properties of the photopigment in the cone through to a complete absence of one or more cone type. This causes a problem with differentiating between colours, ranging from colour blindness to a very slight difference in the perception of certain colours. Complete colour blindness is very rare, as are defects relating to the blue cones.
In the majority of cases, colour vision deficiency is an inherited condition. However, changes in colour perception can occur in a number of diseases and as a side effect of some medications. Most people are unaware of their colour deficiency until they are tested.
The practical implications of a colour vision deficiency depend on its severity. Minor deficiencies are unlikely to cause any problems beyond an inability to differentiate between some subtle changes in colour. However, more significant deficiencies such as protanopia – the absence of the red cone – result in significant problems differentiating between a wide range of colours, and this has implications in everyday life and the workplace.
A plethora of colour vision tests are available, but for screening purposes, pseudoisochromatic tests such as the Ishihara plates have been found to be efficient, sensitive and specific. The Ishihara test requires the patient to identify numbers among an array of coloured dots. The colours of the dots are carefully chosen so that those with colour vision deficiencies will be unable to detect the number or will see a different number.
There is currently no cure for inherited colour vision deficiency because it is not possible to repair or replace the cone cells in the retina. Coloured filters can sometimes help when performing specific tasks involving colour discrimination. Increasing awareness of the problems experienced by those with colour deficiencies has resulted in better guidelines for designers through a more careful selection of colours and the use of additional cues such as patterns and shapes. Tasks and occupations requiring “perfect” colour vision are becoming rare.
Depth perception
One of the many remarkable characteristics of the human visual system is its ability to judge distance and depth. The brain has developed a series of very elaborate mechanisms to extract information about the three-dimensional world from the two-dimensional images formed on the retina of each eye. Using clues contained in the image such as the relative size of objects, converging lines (perspective), textural gradients and superimposition, the brain is able to make pretty good sense of the world with information from one eye only.
Try covering one of your eyes.Now uncover your eye – what has changed? Most people have the added benefit of three-dimensional vision – referred to as stereopsis – when using two eyes. This gives the perception of real three-dimensional depth and distance and allows us to judge the distance of objects with precision.
To experience this additional dimension to perception requires two good eyes with correct alignment. Individuals with a “lazy eye” (amblyopia), misalignment of the eyes (a squint) or any condition that reduces the vision in one or both eyes will not experience stereopsis in full. Three-dimensional TV and cinema are useful screening tools for this condition, as those without stereopsis will tend to complain bitterly about the lack of 3D.
At least 6% of the population do not achieve stereopsis. In most cases, these individuals adapt and live perfectly normal lives. However, they are likely to find certain tasks that require the precise judgment of distance – such as threading a needle, soldering electronic components and fast visuo-motor tasks such as ball games – rather more difficult than those who do achieve stereopsis. Occupations requiring the precise judgment of distance sometimes include a requirement to demonstrate some level of stereopsis.
Stereopsis can be assessed using red/green or polarised anaglyphs and stereograms. These are available as standalone tests, such as the Frisby and Titmus tests, and are included in a number of apps for the iPhone and iPad.
Peripheral visual fields
Stare at the following letter: X. How many of the words on either side can you read without moving your eyes? The answer is probably: “One, just.” This demonstrates that we all have “tunnel vision” to some extent.
|
|
There is only one part of the retina – the macula – capable of delivering good visual acuity and colour vision. The rest of the retina provides a surprisingly poor standard of vision. The role of the peripheral retina is simply to detect the presence of objects. The superbly efficient muscles around the eyes then rotate the eyes to put the object of interest onto the macula where it can be seen in detail and analysed. This process is so effective that most people are blissfully un-aware of their “tunnel vision”.
Despite the limitations of peripheral vision, it is absolutely vital in terms of navigation in the real world. Try looking through a rolled-up piece of paper to see just how important peripheral vision is. Good peripheral vision is also vital in many occupations, and for this reason some form of peripheral vision test is included in many vision standards. Conditions such as glaucoma can cause defects in the peripheral field as can a variety of neurological conditions.
While it is possible to do a very crude test of peripheral vision by checking that an individual can detect wiggling fingers or the top of a pen in the peripheral field, such tests are insensitive.
A thorough investigation of the peripheral fields requires an instrument known as a perimeter or visual field analyser. Such instruments are not normally available in an OH department, but are used routinely as part of a full eye examination by an optometrist. It is strongly recommended that if a peripheral field defect is suspected, the individual is referred for a full eye examination.
The good news is that defective peripheral vision is relatively rare, particularly among the working population.
Professor David Thomson is head of department for vision science at the department of optometry and visual science at City University in London
References
Alfano PL, Michel GF (1990). “Restricting the field of view: perceptual and performance effects”. Perceptual and Motor Skills; vol.70, issue 1, pp.35-45.
Davison PA (1985). “Inter-relationships between British drivers’ visual abilities, age and road accident histories”. Ophthalmic and Physiological Optics; vol.5, issue 2, pp.195-204.
Gegenfurtner KR, Rieger J (2000). “Sensory and cognitive contributions of color to the recognition of natural scenes”. Current Biology; vol.10, issue 13, pp.805-808.
Good GW, Weaver JL, Augsburger AR (1996). “Determination and application of vision standards in industry”. American Journal of Industrial Medicine; vol.30, issue 5, pp.633-640.
Haegerström-Portnoy G (1990). “Color vision”. In: Rosenbloom AA, Morgan MW (eds). Principles and Practice of Pediatric Optometry; pp.449-466. JB Lippincott; Philadelphia.
Haymes SA, Johnston AW, Heyes AD (2002). “Relationship between vision impairment and ability to perform activities of daily living”. Ophthalmic and Physiological Optics; vol.22, issue 2, pp.79-91.
Higgins KE, Wood J, Tait A (1998). “Vision and driving: Selective effect of optical blur on different driving tasks”. Human Factors; vol.40, issue 2, pp.224-232.
Johnson CA, Keltner JL (1983). “Incidence of visual field loss in 20,000 eyes and its relationship to driving performance”. Archives of Ophthalmology; vol.101, issue 3, pp.371-375.
Kennedy A (1989). “Vision testing and microelectronics”. Occupational Health; vol.41, issue 8, pp.222-223.
Latham K, Whitaker D (1996). “A comparison of word recognition and reading performance in foveal and peripheral vision”. Vision Research; vol.36, issue 17, pp.2,665-2,674.
North RV (1985). “The relationship between the extent of visual field and driving performance – a review”. Ophthalmic and Physiological Optics; vol.5, issue 2, pp.205-210.
North RV (1993). Work and the Eye. Oxford University Press; New York.
Scott IU, Feuer WJ, Jacko JA (2002). “Impact of visual function on computer task accuracy and reaction time in a cohort of patients with age-related macular degeneration”. American Journal of Ophthalmology; vol.33, issue 3, pp.350-357.
Taylor WO (1975). “Practical problems of defective colour vision”. Practitioner; vol.214, issue 1283, pp.654-660.
West SK, Rubin GS, Broman AT et al (2002). “How does visual impairment affect performance on tasks of everyday life? The Salisbury eye evaluation project”. Archives of Ophthalmology; vol.120, issue 6, pp.774-780.
Sign up to our weekly round-up of HR news and guidance
Receive the Personnel Today Direct e-newsletter every Wednesday
Westheimer G (1987). “Visual acuity”. In: Adler’s Physiology of the Eye. Clinical Application (8th ed). CV Mosby Co; St Louis, Missouri, US.
Wolffe M (1995). “Role of peripheral vision in terms of critical perception – its relevance to the visually impaired”. Ophthalmic and Physiological Optics; vol.15, issue 5, pp.471-474.