In the second of two articles that provide a blueprint to guide HR functions in overhauling their data approaches, Nick Kelmsley, co-director at the Centre for HR Excellence, Henley Business School, offers an example of how this could be applied to something tangible: talent metrics.
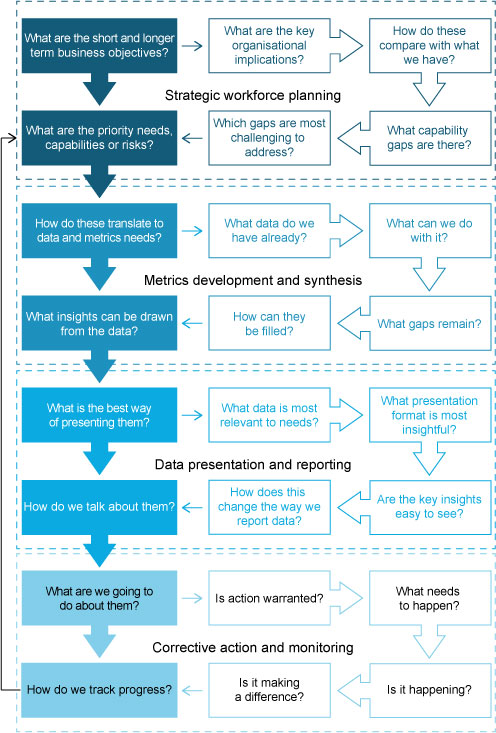
In the first article I presented a blueprint for alignment of HR metrics with business objectives (also shown below). Here, I will look at how more concise and business-focused presentation formats and reporting allows HR to revolutionise its alignment to business objectives, articulate its value and improve its credibility.
In the first article, talent management was used as an example of how HR can become more strategic in its use of data, and we discussed how existing talent data covers areas such as:
- time to hire;
- percentage internal versus external hire;
- total attrition;
- basic performance data – for example, rating profiles; and
- basic succession data – for example, roles with successors ready to take over.
Now I will look at more internally focused talent metrics and more relevant ways of reporting that lead to better business outcomes. These include:
- Percentage of occasions a critical role is filled by the named successor. This is a really insightful metric. Succession planning is an area where there is a tendency to use process metrics instead of outcome metrics. Measuring the percentage of roles with “ready now” successors alone does little more than identify how many empty boxes we have on a chart. It will not tell us if John Smith is successor to 12 different roles, or if we end up recruiting externally because Annette Dubois does not want to move to Dubai. We need to measure what actually happens.
- What happened to those people we said were great three years ago? How many HR functions actually measure this? If these people are still broadly where they were, or have left, then something is clearly wrong with how we identify potential, or act on it. Another insightful metric in the same arena is to examine promotions over a period of time and correlate this with ratings of individuals’ potential. One organisation I worked with identified that 75% of promotions were applied to individuals rated “remain in role”. What does this tell you?
- Mobility. If the organisation wishes to grow into new geographies but operates in a niche sector, it is important to the business that it understands the potential for moving its existing people around.
- Diversity. How many of us present data on gender or nationality with no real context at all? Yes, it is important to ensure that we are promoting inclusiveness and equality of opportunity, but diversity also has a top-down element: what diversity does the organisation need to deliver its objectives? Expressed in this way, diversity is just another way of asking: “What talent do you need?” If, like a financial services organisation I worked with, your customer profile is evolving to include a higher proportion of female entrepreneurs and a growth in Eastern European wealth, you need to ask to what degree this diversity is reflected in your organisation. In this context, measuring gender and national diversity is of critical relevance, but how many times do we lead with this data when other elements may be of much greater strategic importance?
What about data presentation and reporting? Let’s go back to the hypothetical example of the engineering-biased technology business that we discussed in the first article. The current data pack is quite lengthy, and comprises a large number of metrics chosen by HR from its existing data warehouse. There is a “dashboard” on the front page, with certain data highlighted for discussion – for example, the number of current resourcing assignments and average time to hire.
Currently, HR data forms a 45-minute slot on the board agenda each month, but attention seems to drop among board members during this session and it is frequently postponed in favour of more pressing business.
Imagine if the data pack was reworked in the following way:
- The front page showed a table of key business objectives versus critical organisational risks, with each marked red, amber or green to summarise progress. There is a “points of note” section.
- The second page comprised a set of carefully chosen metrics to provide the best possible insights relating to the organisational enablement of these business objectives – for example, some of the talent metrics relating to digital marketing skills. There are easy-to-read graphics showing trends over time or highlighting data of interest, along with a concise narrative offering a view on what is going on and what needs to be done.
- The remainder of the document is a summarised version of “background data” on issues such as diversity, recruitment or full-time equivalents. Anything of note has been pulled forward into earlier sections, and the default position is not to review this data in the actual board meeting unless it is relevant to the agenda. Board members may read it at their leisure before or after the meeting.
- The focus of the report changes with time, to reflect changing business situations and external market factors.
We can imagine that the more insightful data, presented in a more focused way that draws attention to matters of business-relevant concern, may well be more successful in engaging a senior audience in people data and metrics. This will make HR a more credible partner because the function can bring to bear insights based on its own expertise.
However, reporting the metrics is only part of the story. HR has to be seen to be proposing strategies to validate and address issues identified through such measurement approaches, and reporting back on progress. When an issue is raised to a CEO, his or her next question is likely to be: “So what should we do about it?” This is where HR can reap the reward of having developed a set of outcome and process measures, since this can help it to identify where people processes need to be improved or redesigned in the context of business objectives (for example, changes to reward and flexible working policies), or where more fundamental strategies should be proposed (for example, creating partnerships with specific universities or moving to new downstream suppliers). Trend measures then allow HR to show to what degree gaps are being closed.
Summary
HR data and metrics remains a critical and largely under-exploited opportunity for HR to crystallise its value in business. Overhauling capability in this area may well involve investment in system capability, but there is a very significant opportunity to do a lot more with what we already have.
Key to this is the creation of context through strategic workforce planning approaches, which helps us identify which data is going to be most important in the first place. Insight is the key currency, and HR should synthesise its data in areas such as talent management to ask the right question, rather than relay answers that lack context.
Sign up to our weekly round-up of HR news and guidance
Receive the Personnel Today Direct e-newsletter every Wednesday
More concise and business-focused presentation formats and reporting allows HR to revolutionise its alignment to business objectives, articulate its value and improve its credibility, and is perhaps the most obvious way for HR to demonstrate return on investment.
Metrics alignment blueprint